 Joint Rotary Actuators Series HAT
 Joint Rotary Actuators series HAS
 Joint Rotary Actuators Series HAMF
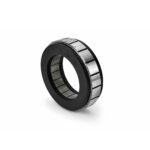 Frameless Torque Motor HBM
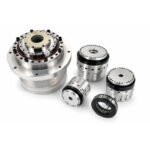 Rotary Actuators
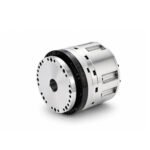 Joint Rotary Actuators Series HAG
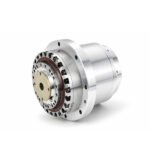 Rotary Actuators Series HPG
Introduction: Your Roadmap to Accurate Motor Selection
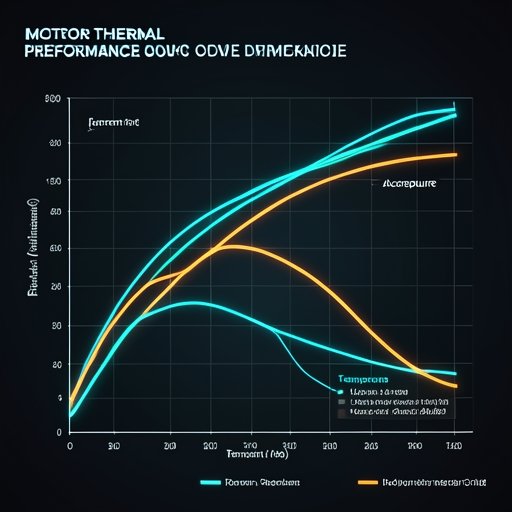
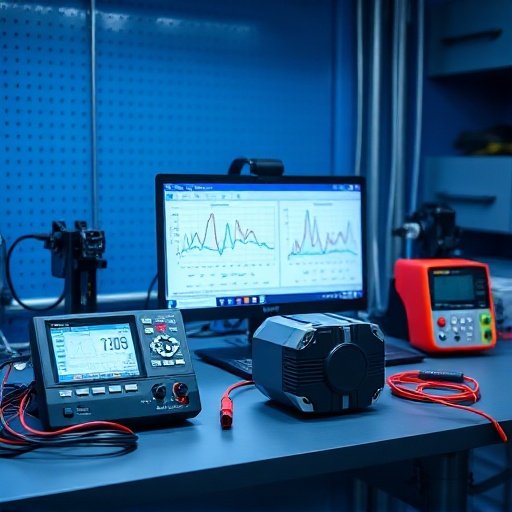
When you open a datasheet for a high-performance servo motor or a frameless torque motor, you are met with a wall of numbers. While tables are helpful, they don’t tell the whole story. The single most important piece of information for any engineer is the torque-speed curve.
Think of this curve as a “performance map” of the motor’s capabilities. It defines exactly how much force the motor can exert at any given rotational velocity. Selecting a motor based on its peak torque alone is a common mistake that leads to overheating and project delays. Mastering the torque-speed curve is the only way to ensure accurate motor selection. This guide will turn those abstract lines into actionable data for your next project.
Anatomy of the Torque-Speed Curve: The Basics
Before we dive into the regions, we must understand what the axes are telling us. In electrical engineering, these charts follow a standardized format.
The Vertical Axis (Y): Understanding Torque and Current
The Y-axis represents torque, usually measured in Newton-meters (Nm). In a permanent magnet motor, torque is directly proportional to the current supplied by the drive. The higher you go on the Y-axis, the more current the motor is consuming and the more heat it is generating.
The Horizontal Axis (X): Speed, RPM, and Angular Velocity
The X-axis represents the rotational speed, typically in Revolutions Per Minute (RPM). As speed increases, the motor’s ability to produce torque eventually begins to drop due to a phenomenon called Back-EMF (Electromotive Force).
The Two Worlds of Motor Performance: Continuous vs. Peak
Most performance charts show two distinct lines or shaded areas. Distinguishing between them is the difference between a machine that runs 24/7 and one that fails in an hour.
The Continuous Operation Region (S1): Your Machine’s “All Day” Capability
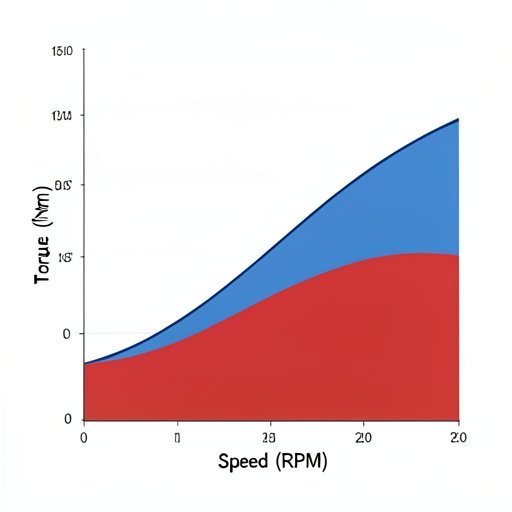
The lower region, often shaded in blue or bordered by a solid line, is the “Continuous Duty” area. This defines the torque the motor can produce indefinitely without exceeding its rated temperature. If your application requires the motor to spin a heavy load at a constant speed for long periods, your operating points must stay within this region.
The Intermittent Duty Region: Pushing for Peak Acceleration
The upper region, often shaded in red or bordered by a dashed line, is the “Intermittent” or “Peak” region. The motor can operate here for very short bursts—typically a few seconds—to provide the extra force needed for rapid acceleration or overcoming a temporary snag. Using this region for continuous work will lead to rapid thermal failure.
Understanding Critical Inflection Points
There are specific points on the torque-speed curve where the physics of the motor changes.
Rated Speed and the Voltage Limit (Back-EMF)
You will notice a point where the continuous torque line begins to slope downward. This is often the “Rated Speed.” Beyond this point, the voltage generated by the motor (Back-EMF) begins to rival the voltage supplied by the drive. To go faster, the motor must sacrifice torque.
The Theoretical No-Load Speed and Why You Can’t Reach It
The point where the curve touches the X-axis (zero torque) is the “No-Load Speed.” This is the absolute maximum speed the motor can spin with no external friction or load. In a real-world servo system, you should never plan to operate near this point, as you will have no control authority left.
Putting it Into Practice: Matching Your Load to the Chart
How do you use this chart for motor selection? You must plot your application’s specific needs.
Plotting Your Application Points (Acceleration vs. Steady State)
A typical motion cycle has two main points:
- Acceleration Point: The high torque required to get the load moving. This point can fall in the Intermittent Region.
- Steady-State Point: The torque required to maintain speed against friction. This point must fall within the Continuous Region.
The 20% Safety Margin Strategy for Real-World Reliability
Engineering is about handling the unexpected. We recommend that your steady-state operating point consumes no more than 80% of the motor’s continuous capacity. This 20% “safety buffer” accounts for environmental temperature spikes, mechanical wear, and slight increases in friction over the machine’s life.
Conclusion: Data-Driven Selection for Precision Motion
A torque-speed curve is more than just a graph; it is the true voice of the hardware. It tells you exactly where the motor is comfortable and where it is being pushed to its limits. By moving beyond simple “peak torque” numbers and embracing the full curve, you ensure your motor performance meets the demands of your application.
Always consult the performance curves early in the design cycle. It is much easier to change a motor model on a drawing than it is to replace a burned-out motor on a finished machine. Data-driven selection is the foundation of every reliable, high-precision automation system.
FAQ Section: Common Questions on Motor Charts
Q1: How does input voltage change the shape of the torque-speed curve?
Voltage primarily affects the X-axis. Increasing the supply voltage pushes the “voltage limit” further to the right, allowing the motor to maintain its torque at higher speeds. It does not significantly increase the maximum torque available at low speeds.
Q2: Does the ambient temperature shift these lines?
Yes. Most charts are rated for 25°C or 40°C. If your environment is hotter, the continuous operation region shrinks because the motor cannot dissipate heat as effectively. You must “de-rate” the motor’s performance in hot conditions.
Q3: Are curves for frameless torque motors different from geared actuators?
A frameless torque motor has a very flat, wide curve because it is designed for low-speed, high-torque direct-drive work. A geared actuator’s curve is a combination of the motor curve and the gearbox efficiency/ratio, which often results in much higher torque but lower top speeds.